Analytics Overview
When you and your visitors use the tours you have created on the Guide-ID platform, the system automatically collects analytics data. These metrics are invaluable for evaluating the performance of your tours, stops, and clips, as well as analyzing user engagement with quizzes and surveys.
Finding the analytics page
Section titled “Finding the analytics page”Upon logging in to the Guide-ID platform, you will land on the Dashboard. To navigate to the Analytics page, simply locate it in the sidebar below the Dashboard section.
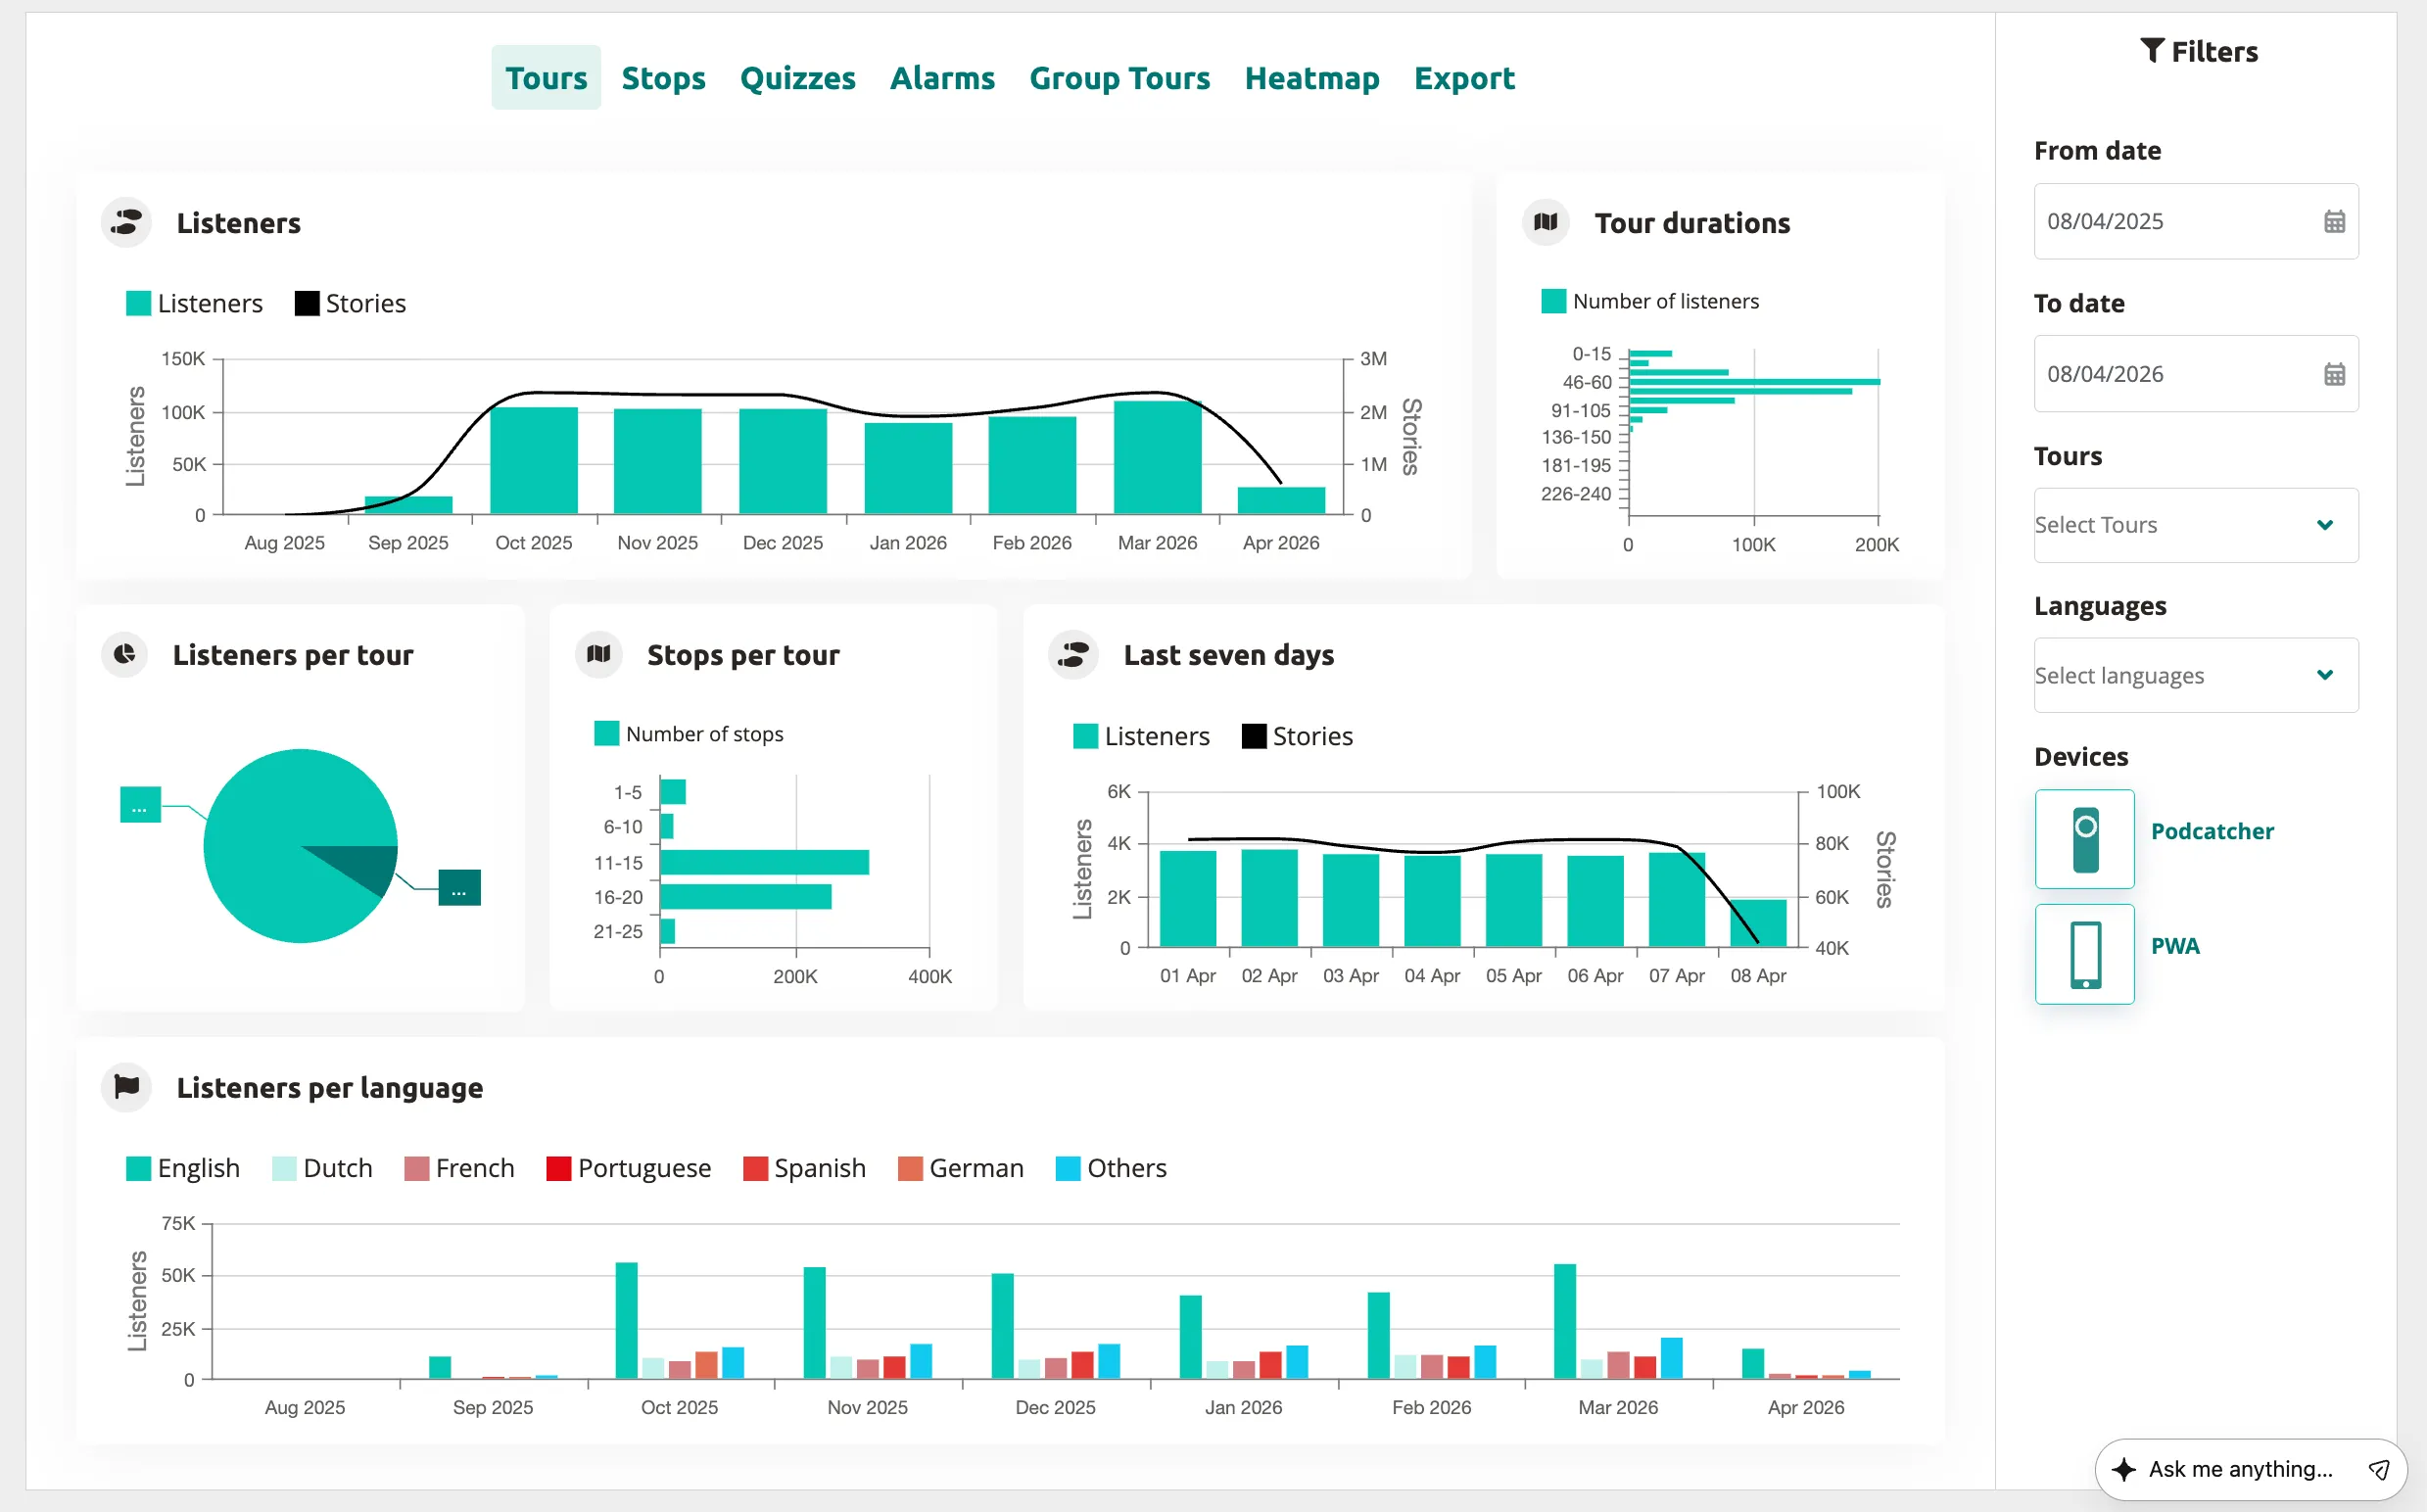
Within the tours tab, you will find a collection of informative graphs that provide key details about your tours. These include:
- Listeners
- Tour durations
- Listeners per tour
- Stops per tour
- Last seven days
- Listeners per language
The stops tab ranks stop engagement and shows where visitors drop off during a tour. Popular stops typically indicate visitor preferences, while less frequented stops may be situated in less accessible areas or encountered when visitors are fatigued from the tour through the museum.
Quizzes
Section titled “Quizzes”By navigating to the quizzes tab, you can review the results of quizzes and surveys. This section provides information on the chosen options and how they compare to alternative choices, offering valuable insights into visitor preferences and opinions.
Alarms
Section titled “Alarms”In the alarms tab, you can monitor the frequency at which alarms were triggered and identify the most commonly activated alarm (if multiple alarms are set up).
Group tours
Section titled “Group tours”The group tours tab provides an overview of the number of group tours conducted and the group size, allowing you to evaluate the popularity and dynamics of group experiences.
By leveraging these powerful analytics features of the platform, you can make data-driven decisions to enhance the performance of your tours, improve visitor engagement, and ensure a memorable experience for all.
Export
Section titled “Export”From the Export tab, you can download analytics data about stops yourself, to be used to create your own displays or to combine with data from other analytics platforms you use for your museum. See the Exporting Analytics Data documentation for more information.
Analytics Tabs
Section titled “Analytics Tabs”The Analytics section contains these specialized views:
- Tours — Listener counts, tour durations, language distribution, and weekly trends
- Stops — Stop engagement ranking, top stops, and drop-off
- Heatmap — Daily listening patterns per stop in a color-coded grid
- Quizzes — Quiz results and visitor responses
- Group Tours — Group tour usage and guide activity
- Export — Download raw analytics data as CSV
Related articles
Section titled “Related articles”- Dashboard Overview — your main Platform starting point
- Data Export — download analytics data as CSV
- Actionable Insights — automated recommendations from your data