Insights: Clips
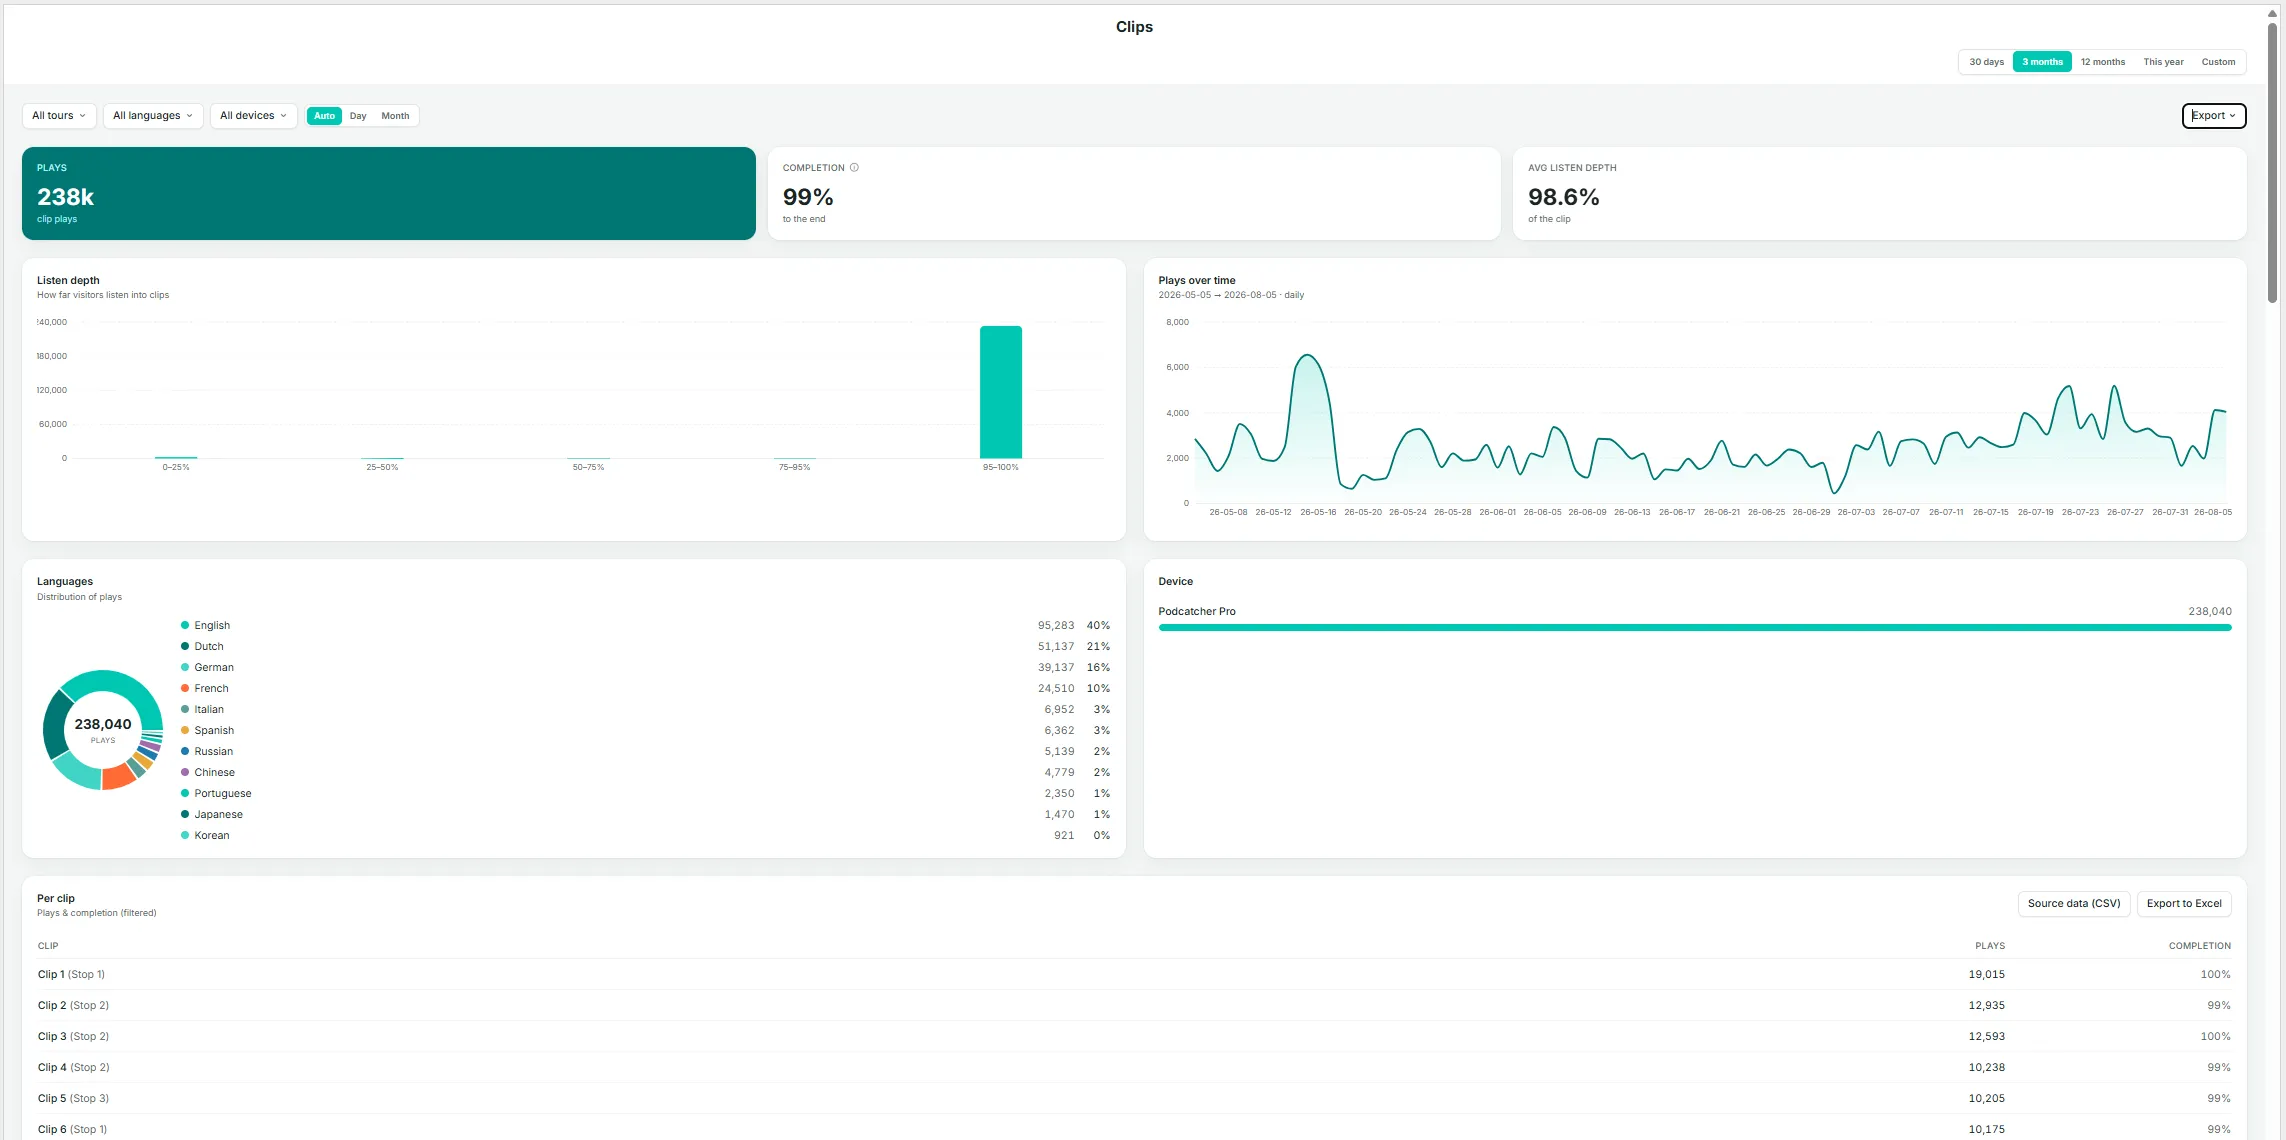
The Clips page is the most granular level of detail within Insights. A story can consist of several clips — for example, an introduction, a choice point, and a follow-up — and this page shows how much of each individual clip is actually heard.

Key Metrics
Section titled “Key Metrics”- Plays — total clip plays in the current selection.
- Completion — the percentage of plays that reached the end of the clip.
- Avg listen depth — the average distance listeners get into a clip, expressed as a percentage across all plays — a more granular companion to Completion.
Listen Depth
Section titled “Listen Depth”A histogram grouping plays by how far they progressed (0–25%, 25–50%, 50–75%, 75–95%, 95–100%). A well-performing clip should show most plays in the 95–100% band; a large share of early drop-off in another band indicates a clip worth reviewing for length, pacing, or content.
Plays Over Time
Section titled “Plays Over Time”Daily play volume for clips in the current selection.
Languages
Section titled “Languages”A donut chart and list of play share by language.
Device
Section titled “Device”A breakdown by device type.
Per Clip Table
Section titled “Per Clip Table”Clip name (shown with its parent story in parentheses), plays, and completion rate, with Source data (CSV) and Export to Excel options.
Listen Depth Per Clip
Section titled “Listen Depth Per Clip”A stacked bar per clip, ordered by volume, showing the share of plays in each depth band (darker shading indicates a more complete listen). Select Show all clips to view beyond the default set.