Insights: Stop Statistics
The Stops page shows which individual stories (stops) are played, how often, and when. The sidebar labels this page Stops; the page itself is titled Stories — a stop on a tour is the point at which a story plays, so the two terms describe the same thing from different angles: the physical location versus the audio content delivered there.
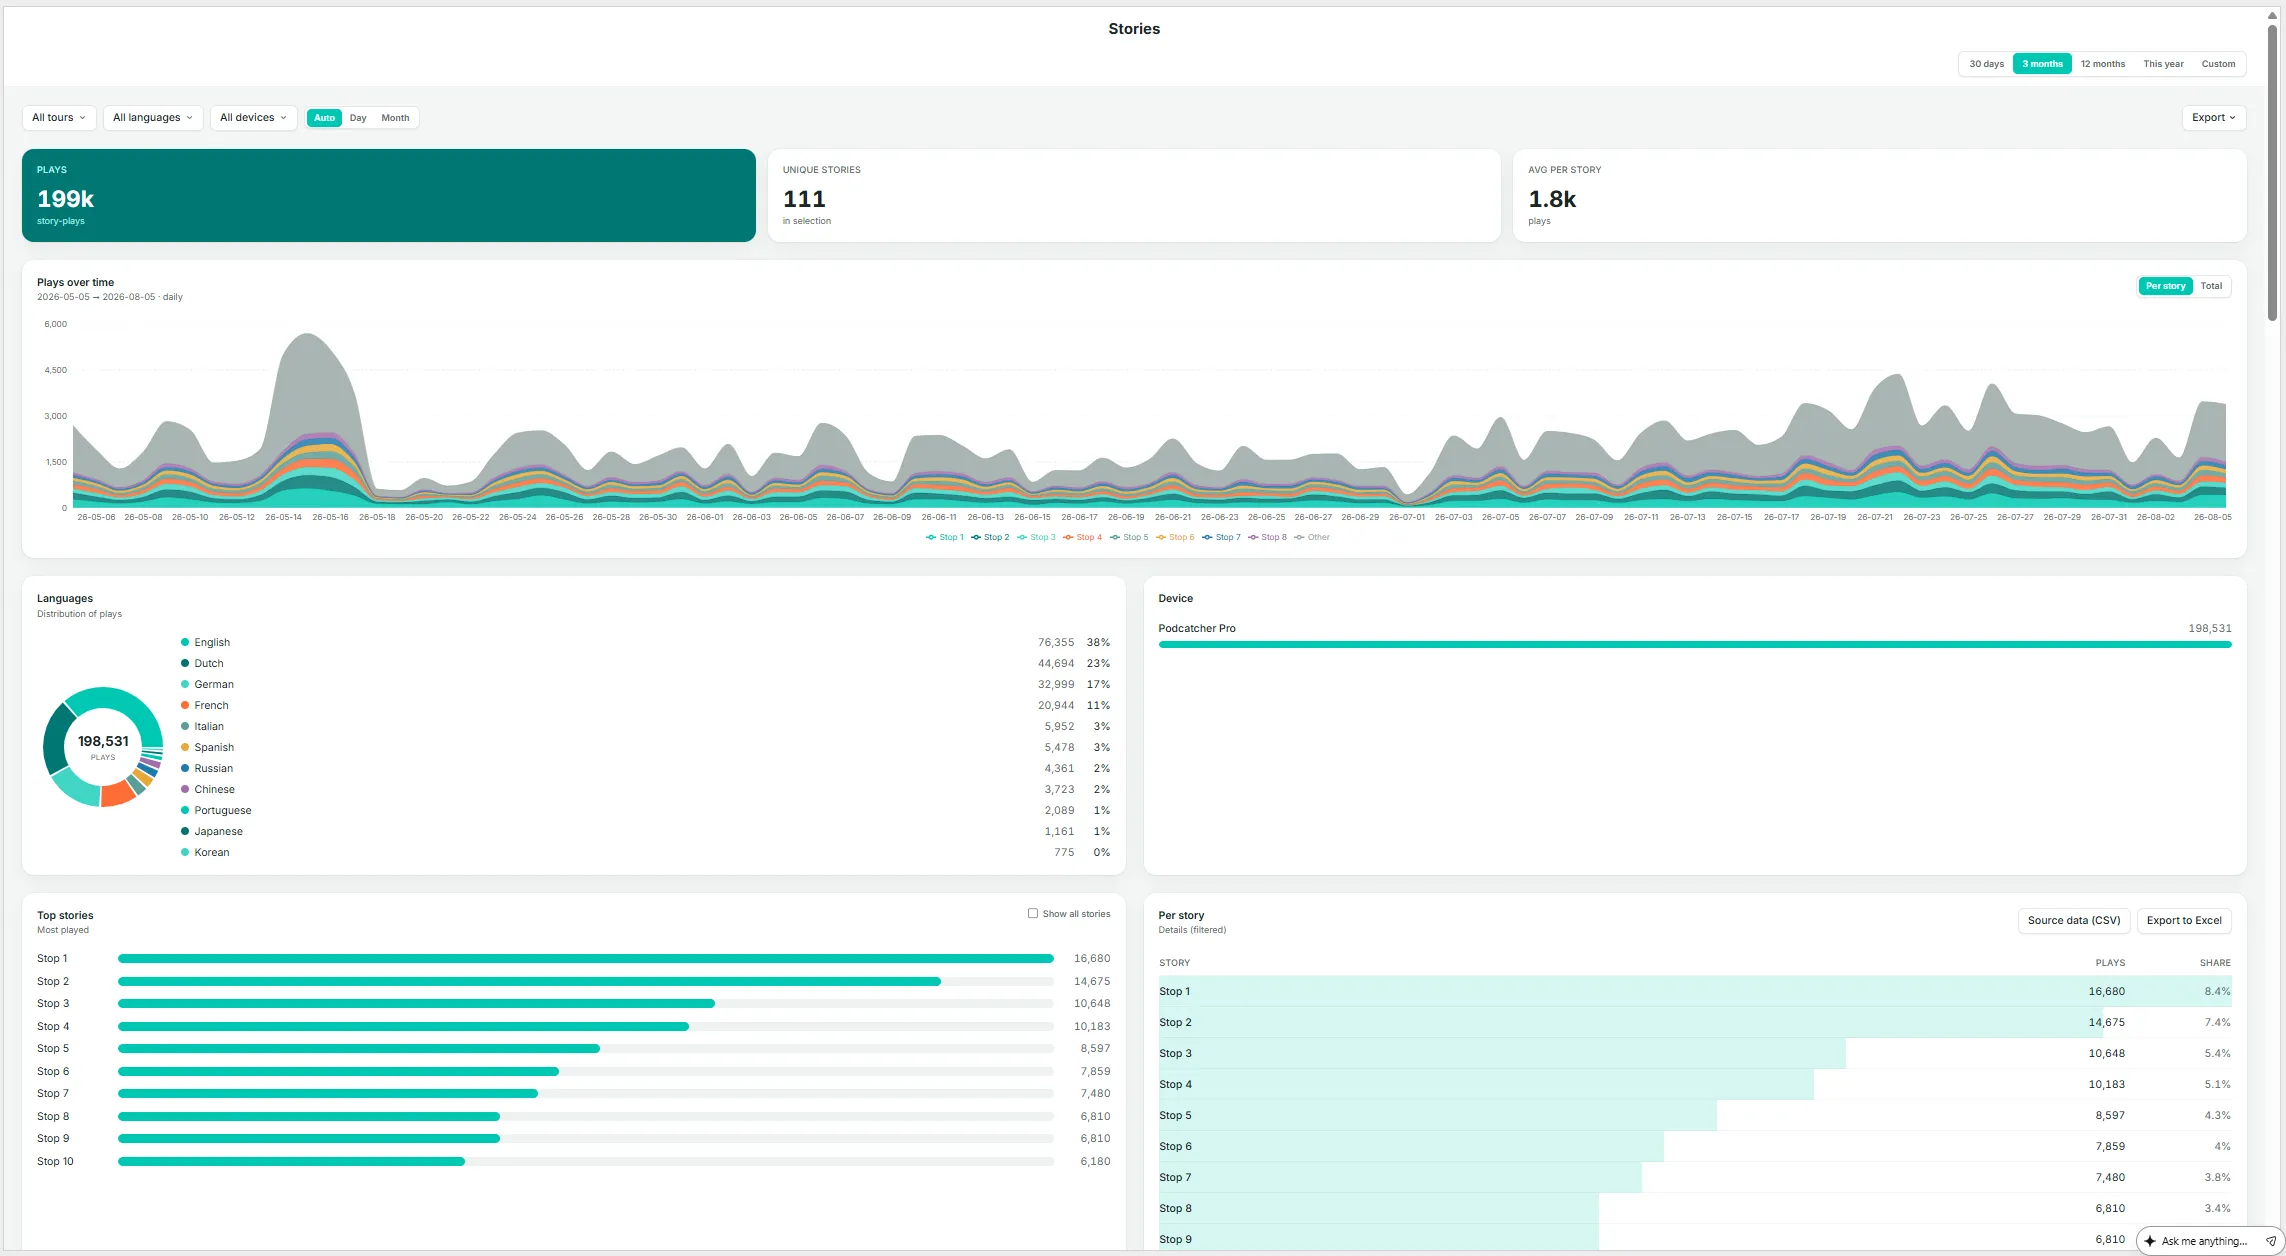
Key Metrics
Section titled “Key Metrics”- Plays — total story-plays in the current selection (one listener playing one story once counts as one play).
- Unique stories — the number of distinct stories played at least once in the selection.
- Avg per story — average plays per story (total plays divided by unique stories).
Plays Over Time
Section titled “Plays Over Time”Play volume stacked by story, toggling between Per story and Total. With a large number of stories, the chart displays the top contributors alongside an “Other” category.
Languages
Section titled “Languages”A donut chart and list showing play share by language.
Device
Section titled “Device”A breakdown by Podcatcher Pro, App, and Mobile Website.
Top Stories
Section titled “Top Stories”A ranked list of the most-played stories. Select Show all stories to expand beyond the default view.
Per Story Table
Section titled “Per Story Table”Story name, plays, and share, sortable and exportable via Source data (CSV) and Export to Excel.
Stories × Time
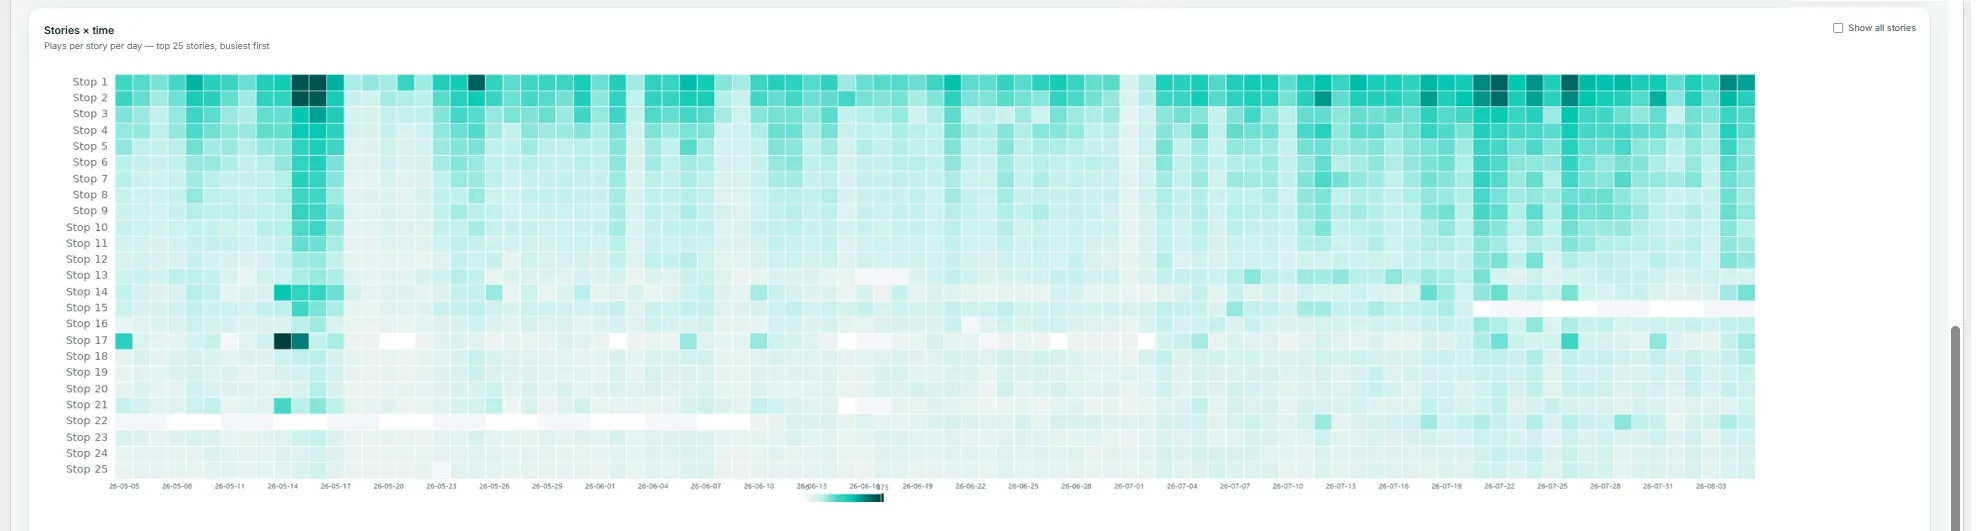
Section titled “Stories × Time”A heatmap of plays per story per day, showing the busiest stories by default (also expandable with Show all stories). This view is useful for spotting a story that suddenly spikes or goes quiet, which more often points to a technical issue — such as a broken trigger point — than a genuine change in visitor interest.