Insights: Languages
The Languages page gives you a focused view of which languages your visitors listen in, and how that mix is trending over time — the detail behind findings such as a language growing in share, as surfaced on the Overview page.
Key Metrics
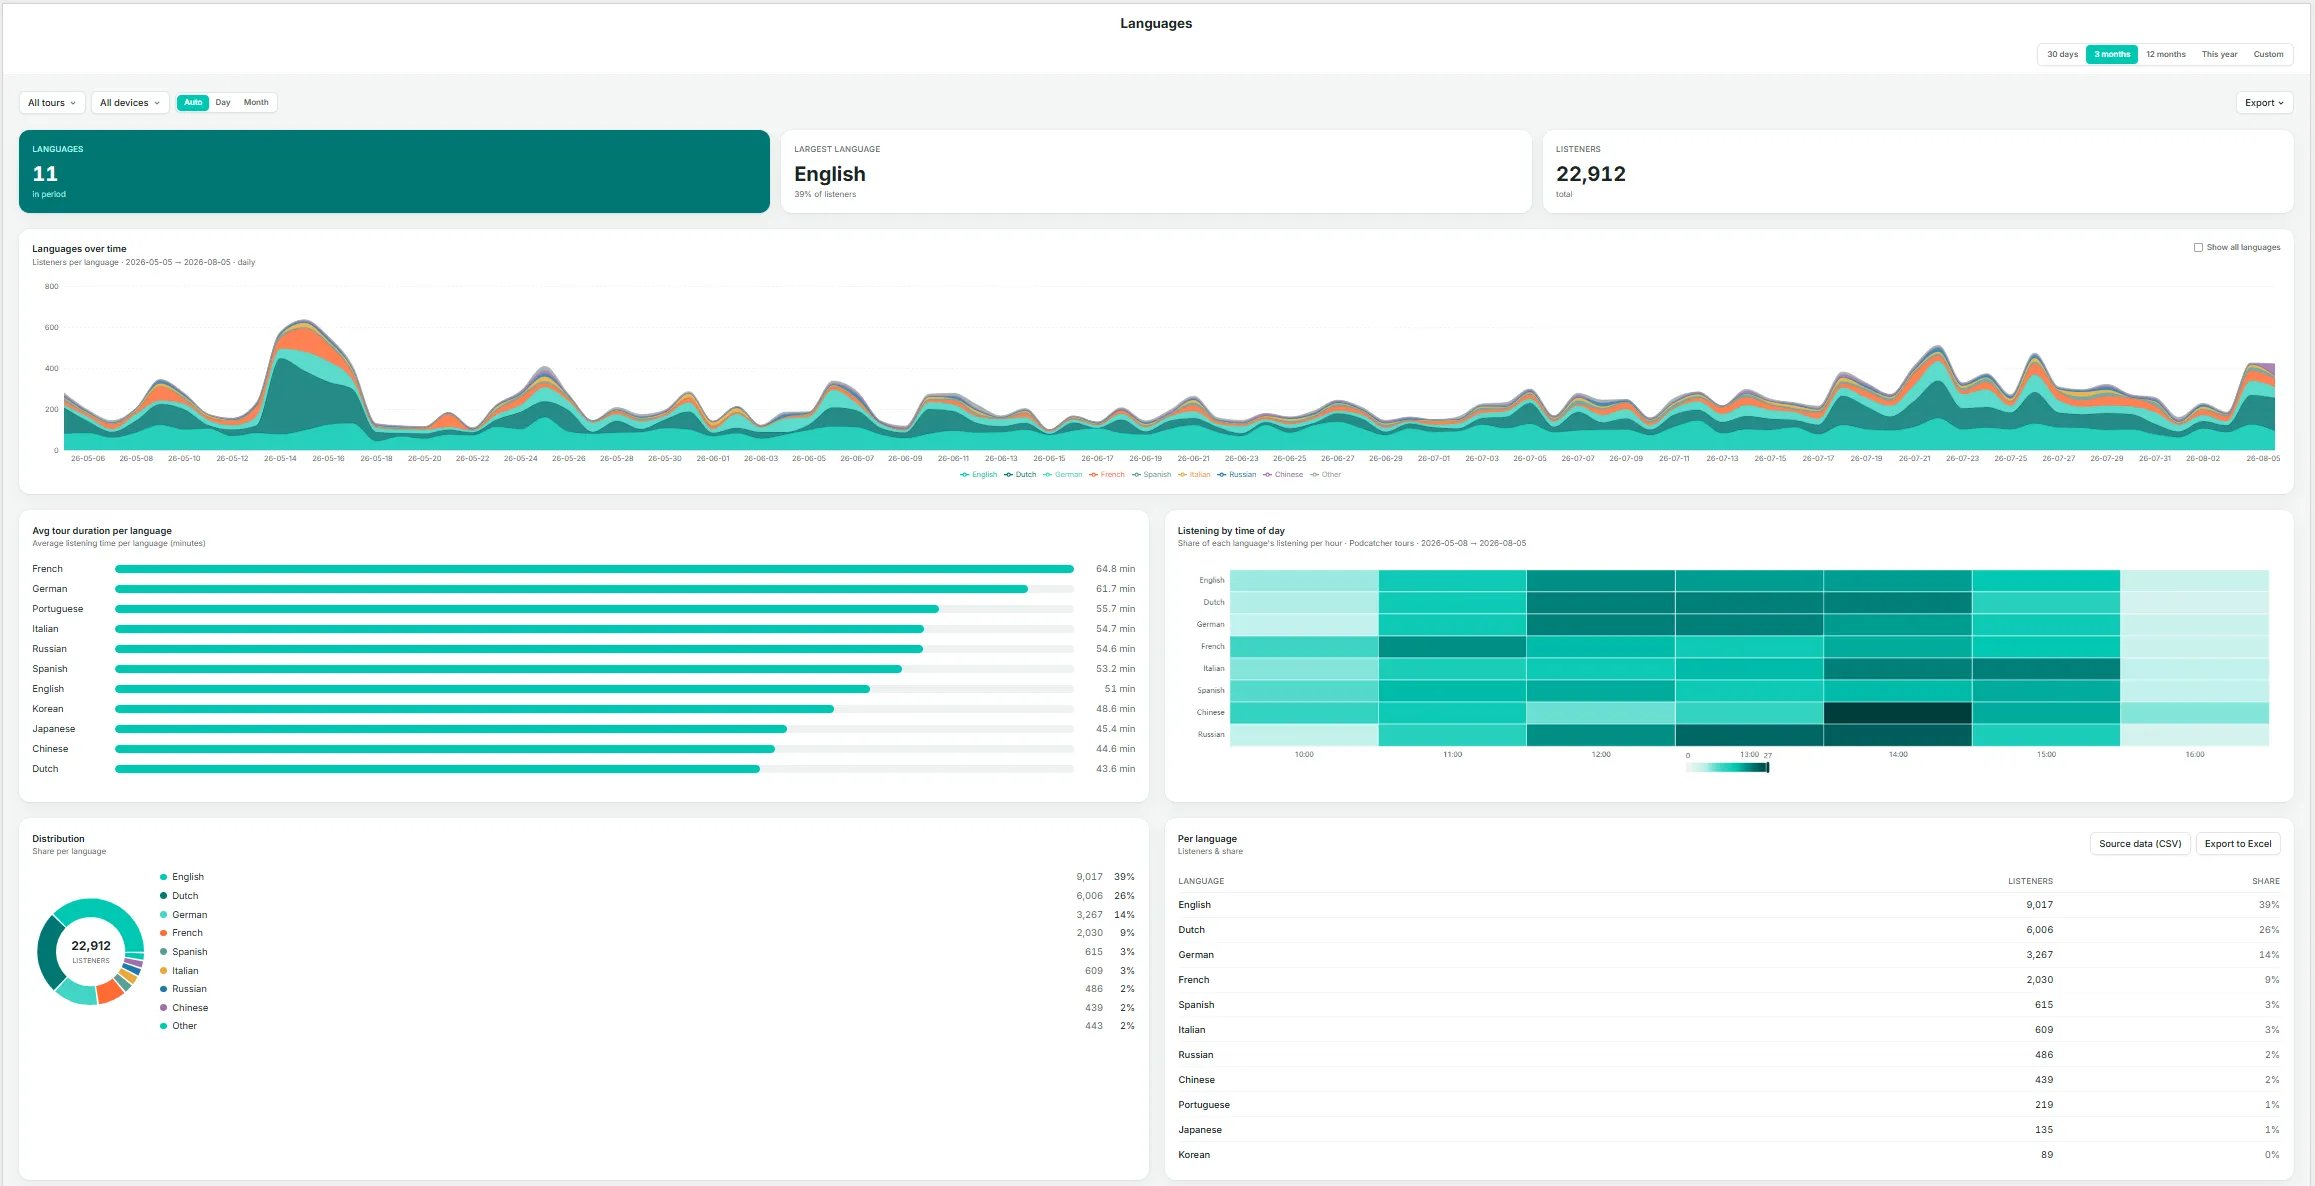
Section titled “Key Metrics”- Languages — the number of distinct languages used during the period.
- Largest language — the single largest language by listener share, with its percentage.
- Listeners — total listeners in the current selection.
Languages Over Time
Section titled “Languages Over Time”A stacked area chart of listeners by language across the date range. By default, smaller languages are grouped together; select Show all languages to display every language individually.
Avg Tour Duration Per Language
Section titled “Avg Tour Duration Per Language”A bar chart ranking languages by average time spent. Notable differences here can indicate translation or narration-pacing issues — for example, if one language runs noticeably longer or shorter than the rest, it may be worth reviewing that recording.
Listening by Time of Day
Section titled “Listening by Time of Day”A heatmap showing each language’s share of listening by hour, useful for identifying whether evening visitors, for instance, skew toward a different language mix than daytime visitors.
Distribution
Section titled “Distribution”A donut chart breakdown of listener share by language.
Per Language Table
Section titled “Per Language Table”Listeners and share for every language, with Source data (CSV) and Export to Excel options.