Insights: Tour Statistics
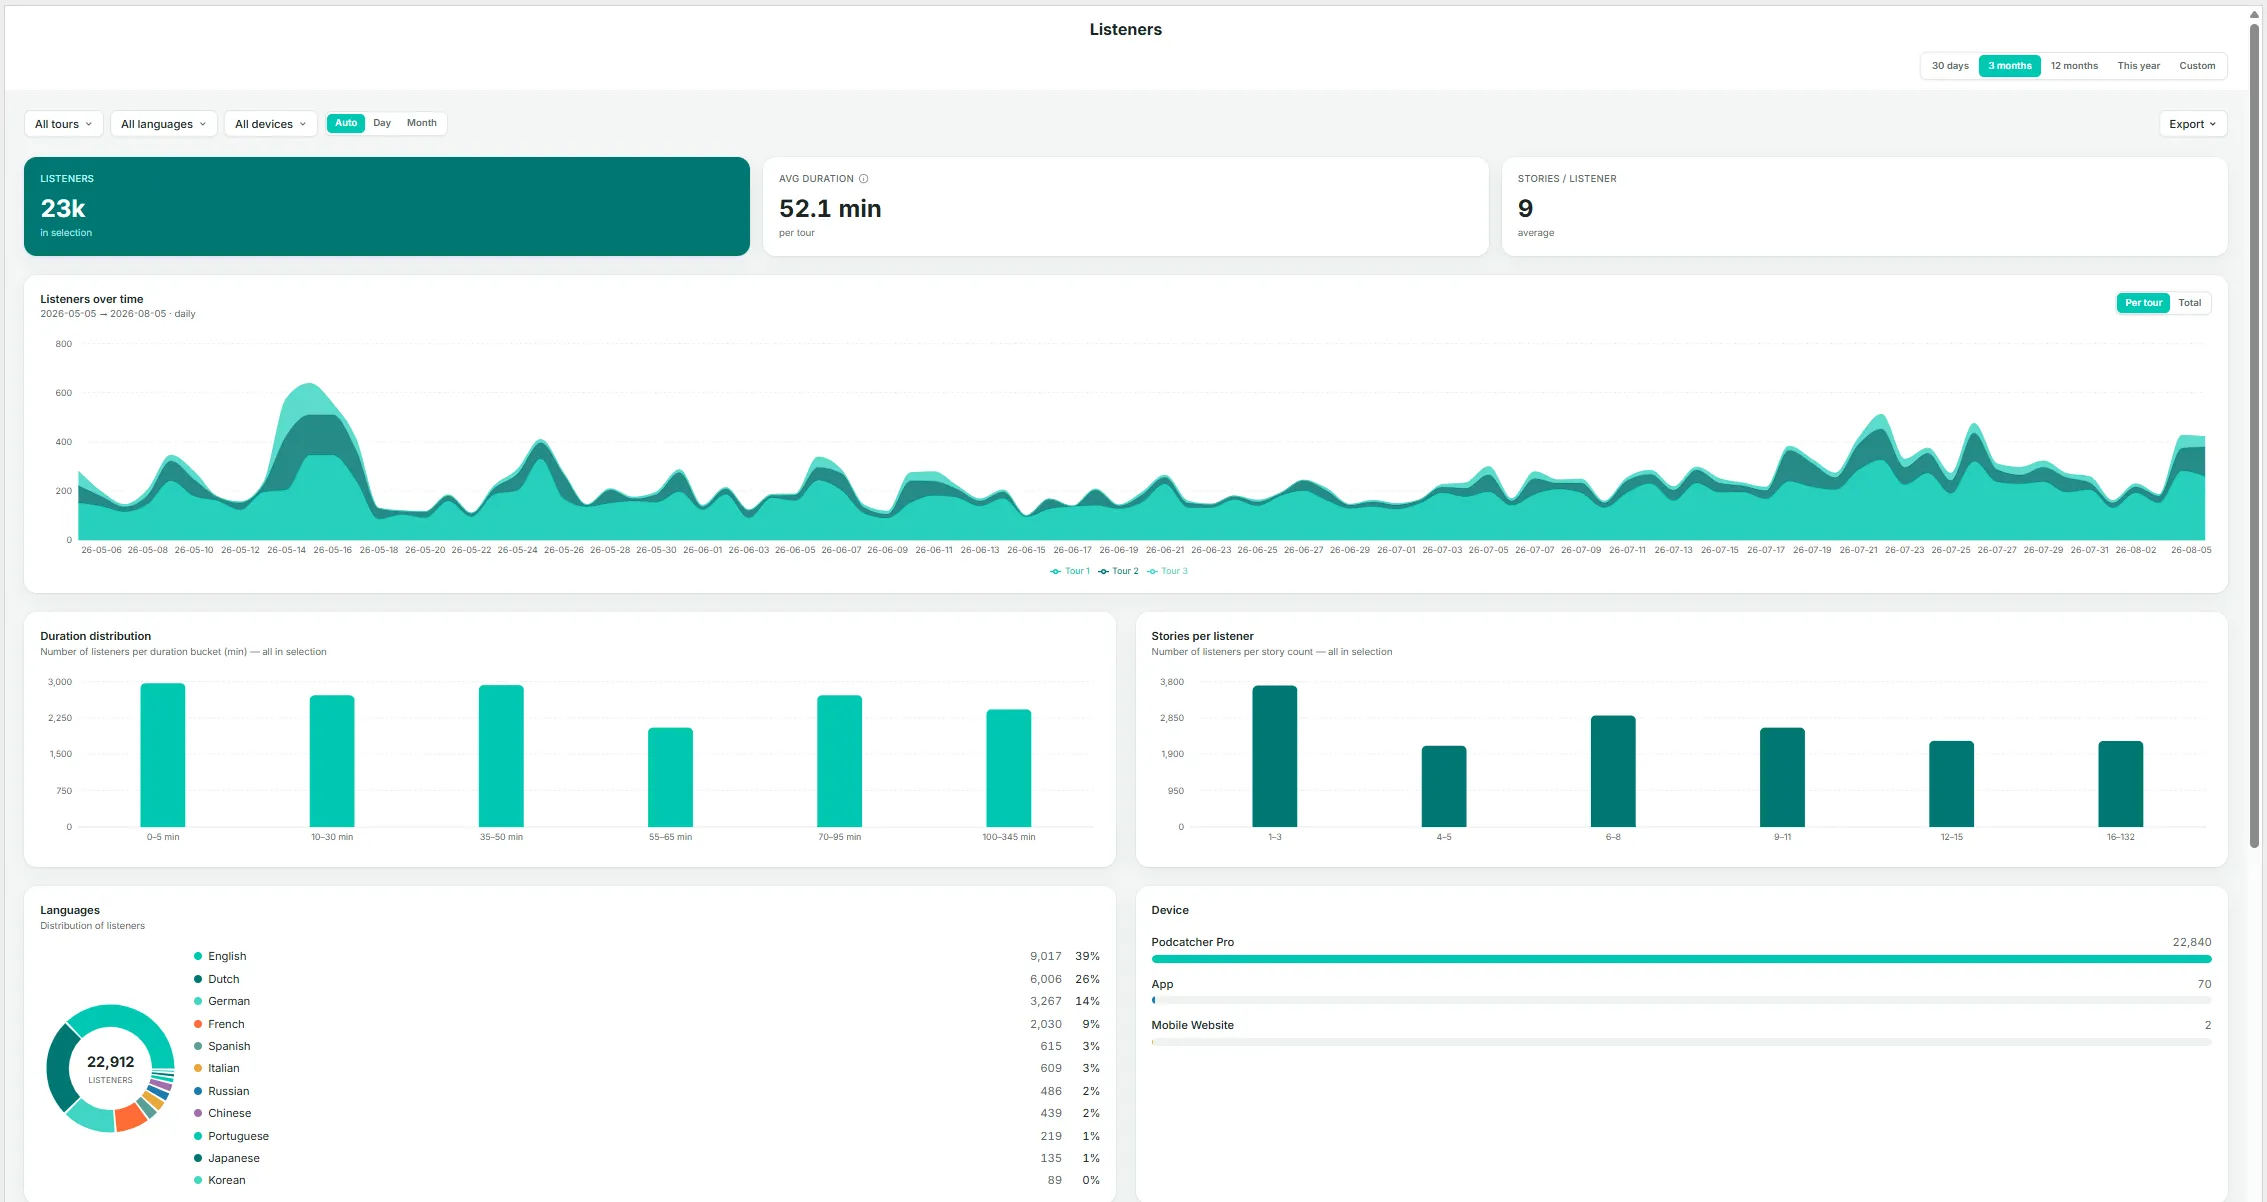
The Tours page shows listener behavior on a per-tour basis — who is listening, for how long, and when. The page itself is titled Listeners, since every chart is built from listener sessions grouped by tour.
Key Metrics
Section titled “Key Metrics”- Listeners — total listeners in the current selection (with any tour, language, or device filters applied).
- Avg duration — average time spent per tour, within the current selection.
- Stories / listener — average number of stories played per listener.
Listeners Over Time
Section titled “Listeners Over Time”Listener volume stacked by tour, showing each tour’s contribution to the total by day. Toggle between Per tour (stacked view) and Total (combined line).
Duration Distribution
Section titled “Duration Distribution”A bar chart grouping listeners by how long they spent (for example, 0–5 min, 10–30 min, 35–45 min, up to 100+ min). Useful for identifying whether most visitors complete the full tour or leave early.
Stories Per Listener
Section titled “Stories Per Listener”A bar chart grouping listeners by how many stories they played (1–2, 3–5, 6–7, and so on). This complements the duration chart: a listener spending a long time but playing few stories may be lingering rather than progressing through the tour.
Languages
Section titled “Languages”A donut chart and list, matching the format on the Languages page but scoped to the current tour and date filters.
Device
Section titled “Device”A breakdown by Podcatcher Pro, App, and Mobile Website.
Listeners by Weekday × Hour
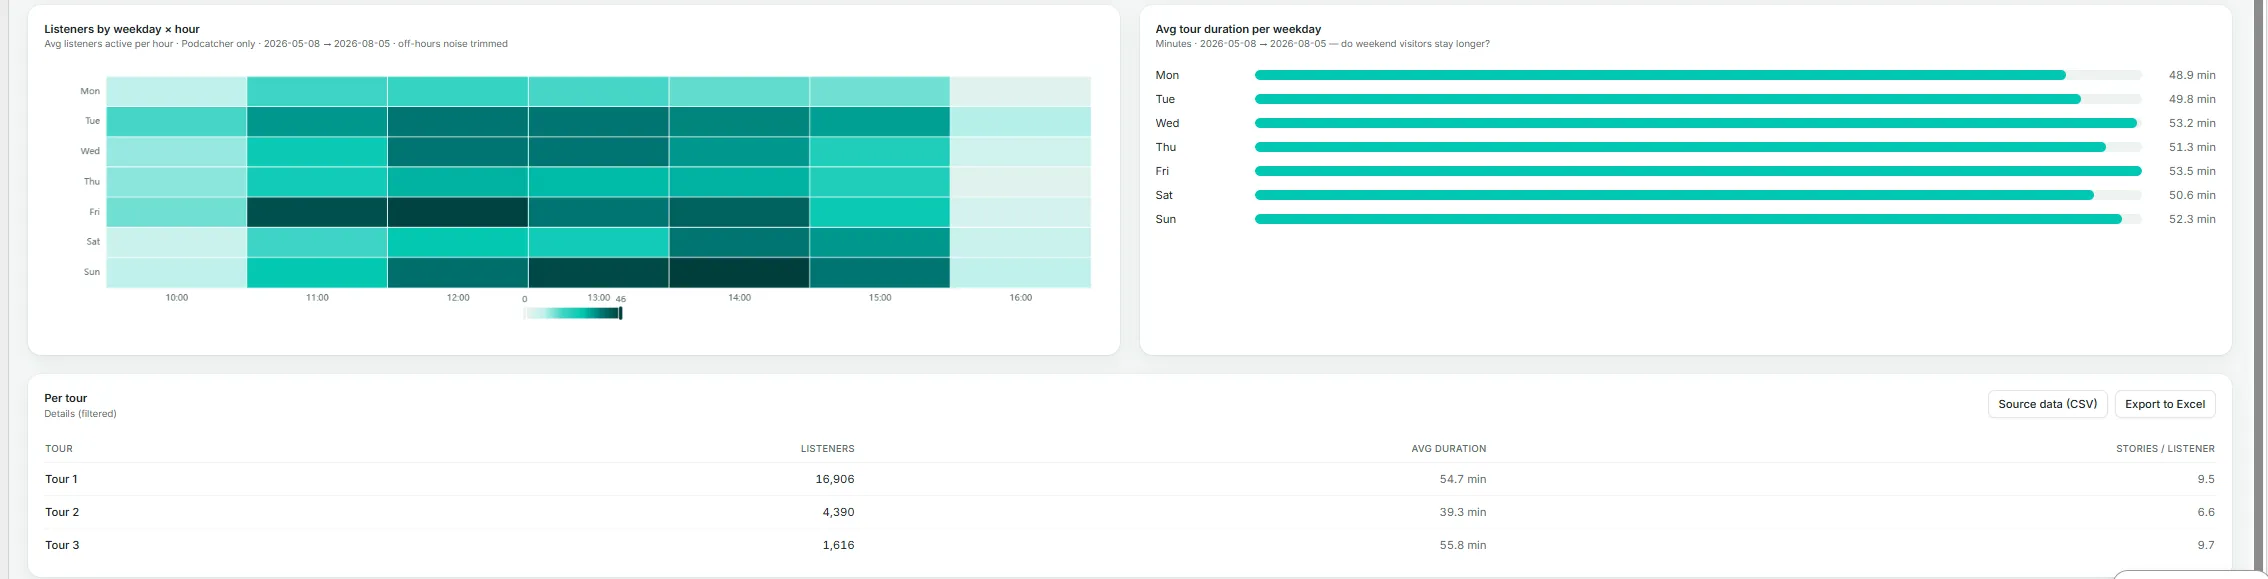
Section titled “Listeners by Weekday × Hour”A heatmap showing when listening activity occurs, with darker cells indicating busier periods. Useful for planning staffing, hardware allocation, or maintenance windows during quieter times.
Avg Tour Duration Per Weekday
Section titled “Avg Tour Duration Per Weekday”A bar chart comparing average duration by day of the week — for example, to check whether weekend visitors spend more time than weekday visitors.
Per Tour Table
Section titled “Per Tour Table”Listeners, average duration, and stories per listener broken out by individual tour, with Source data (CSV) and Export to Excel options.